A visual summary of diagnostic work involving pyrometer sensor placement, thermal reflection interference, and emissivity control using simulated and real-world tools. All visuals are fictionalized for training and NDA compliance.
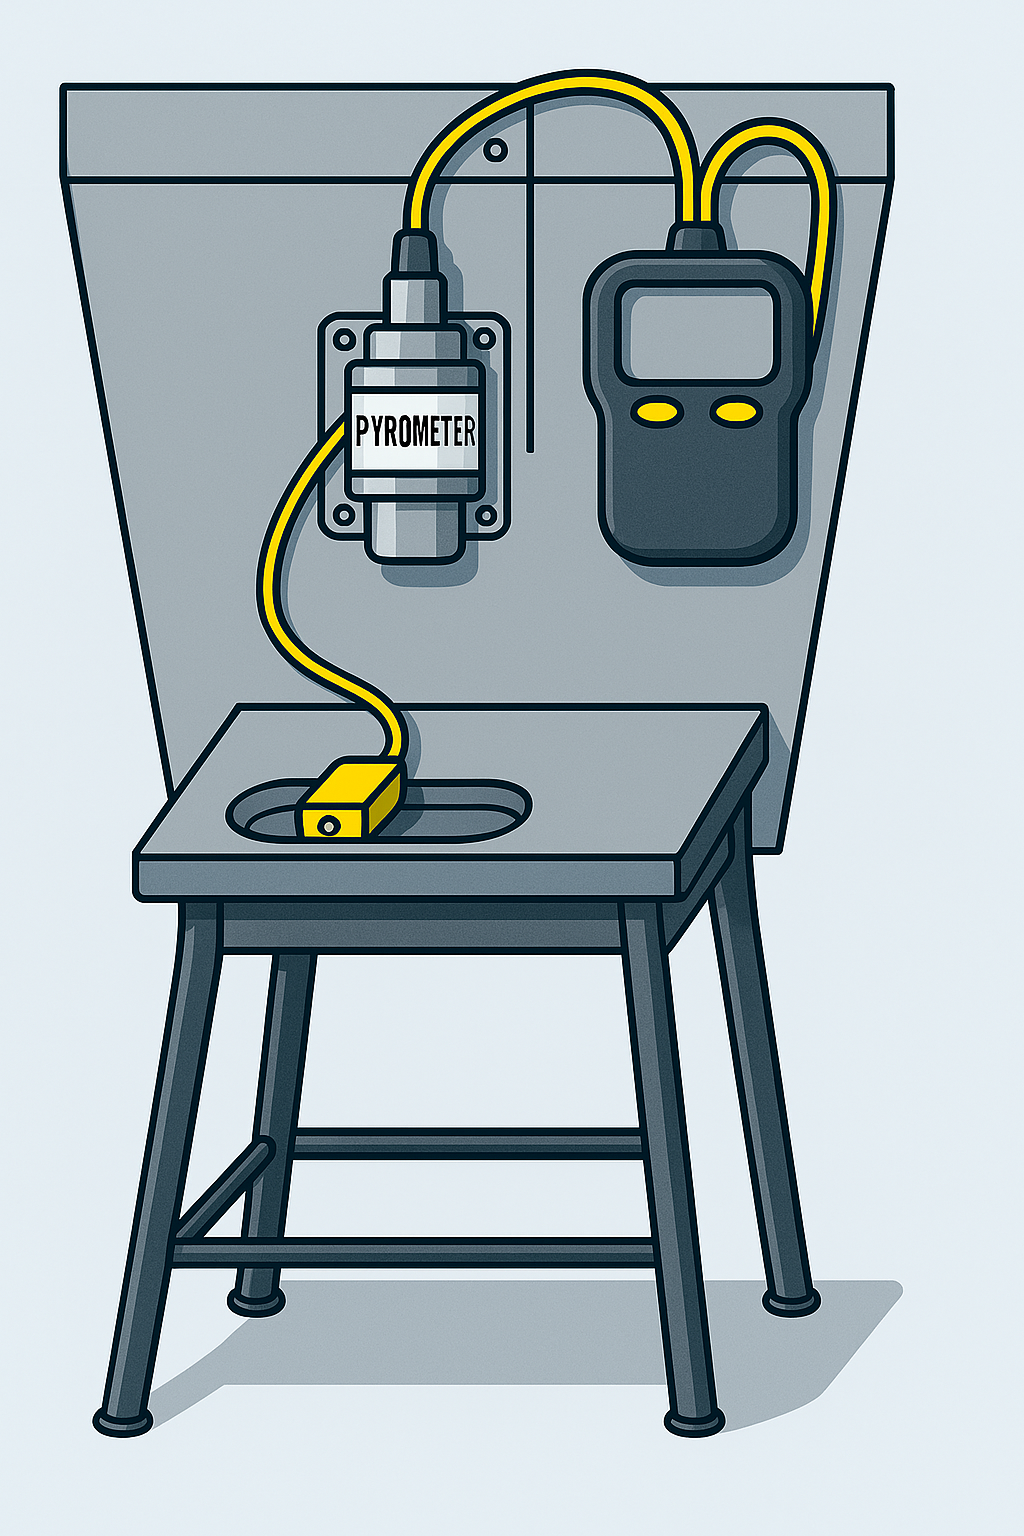
🔬 Pyrometer and Thermocouple Setup (Concept Drawing)
An initial engineering sketch outlining the pyrometer and thermocouple layout used in thermal measurements.
This conceptual drawing illustrates the initial pyrometer thermocouple layout designed for the shop floor.
The design features key elements such as sensor placement and cable routing, which were critical in early temperature testing. It later evolved due to challenges with reflective interference and environmental misalignment, leading to modifications in the setup after further troubleshooting.
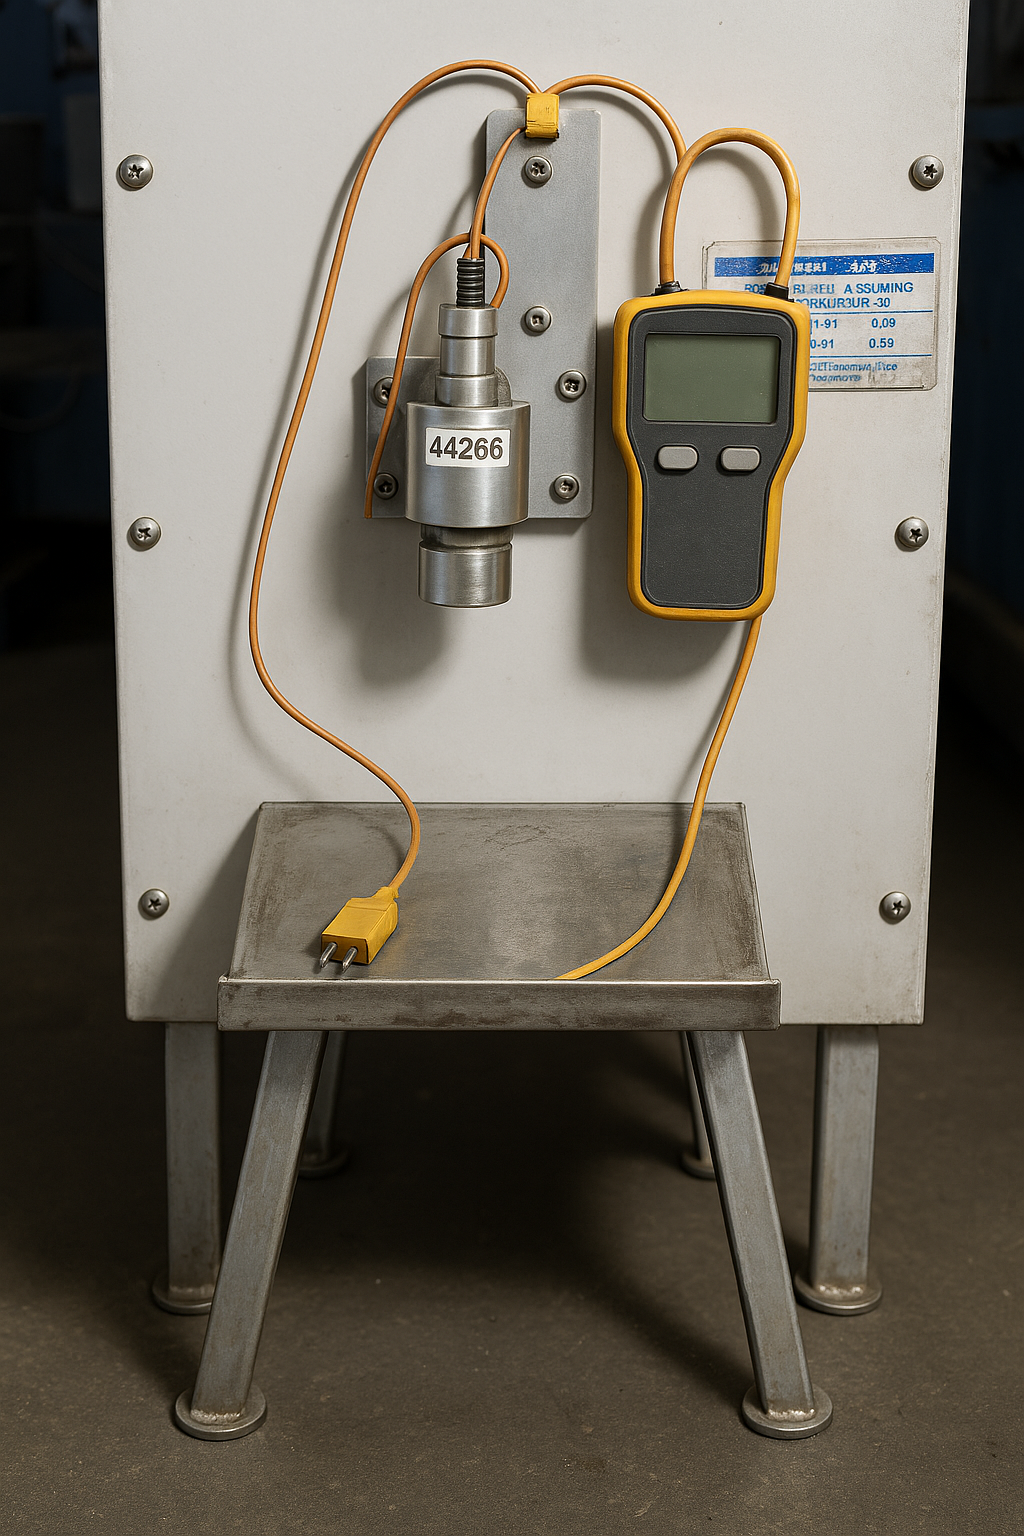
🏭 Simulated Shop Floor Visualization
AI-generated visual of the early temperature monitoring layout — designed to explain setup without using real-site photography.
The bent platform design holds the part securely in the pyrometer’s line of sight, supporting accurate and consistent thermal scanning. This visual demonstrates the temperature measurement strategy while preserving NDA-compliant clarity.
Note: This is a conceptual illustration used to communicate engineering strategy without exposing proprietary elements.
📏 Surface Temperature Verification
Performed surface temperature scans using a Raytek IR thermometer to verify readings and diagnose emissivity mismatch and reflective interference during aluminum thermal profiling.
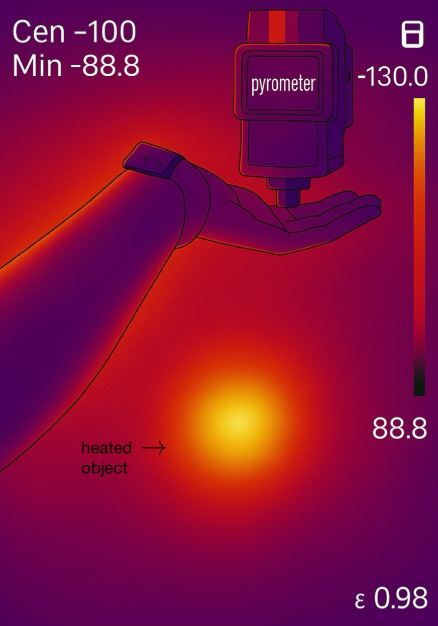
🔧 Troubleshooting Pyrometer Errors in Forging Process
Used hand emissivity (~0.98) to validate thermal reflections and confirm sensor misalignment under high ambient heat conditions.
Aluminum reflects surrounding infrared radiation — often displaying ambient or nearby heat instead of its actual surface temperature. In this case, ambient temperature interference from nearby radiant sources caused misleading pyrometer readings. I directly consulted with Fluke and Williamson engineers to evaluate sensor limitations and proposed equipment upgrades, including repositioned pyrometers and anti-reflective surface solutions, to improve data accuracy in the forging environment.
Note: Representative visual used to communicate diagnostic insights without disclosing proprietary shop floor layouts.
💥 Crushed Elements – Preheat Wiring Failure
Tap to zoom sketch
This hand-drawn simulation recreates a thermal failure inside a forging press, where unshielded heating wires beneath the die bed were crushed during press operation.
🔎 Analysis Focus:
• Pyrometer placement and emissivity risk
• Wiring safety and crush hazard
• Shielding inefficiencies under thermal cycling
🧠 Engineering Impact:
This project helped inform the redesign of safer preheat methods for forge tooling. A new torch-based heating concept was drafted to prevent wire damage and improve uniformity. Due to NDA, the full concept is not shown here — but the mechanism was modeled and conceptually validated during an early development phase.
• • • thermal diagnostic boundary • • •
⬇️ Root Cause Diagnostics – Sensor Calibration Pathway ⬇️
🛠️ Concept vs Simulation Overview
Tap to temporarily zoom
This side-by-side comparison shows a conceptual drawing and an AI-generated simulation of a real-world temperature monitoring setup — offering a realistic sense of the equipment while remaining fully NDA-compliant by avoiding actual site photos.
🔧 Pyrometer Thermocouple Setup – Concept vs AI Visualization
During troubleshooting, the original pyrometer designer was impressed with my findings and asked me to investigate potential operator misuse — prompting a deeper analysis of positioning, emissivity, and environmental alignment.
Root Cause Analysis: Reflective interference, sensor proximity, and thermal misalignment. Fixes included repositioning, IR shielding, and calibrated emissivity checks.
All visuals shown here are anonymized or simulated. Intended for technical validation training and engineering communication.